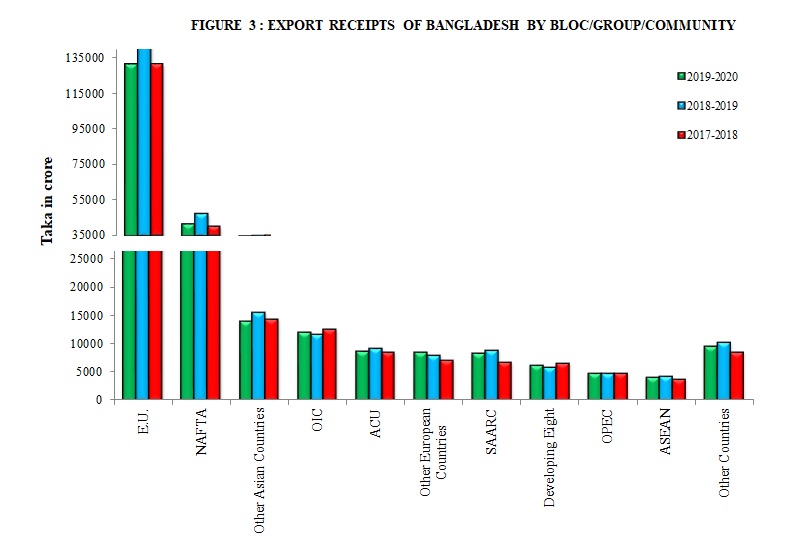
The destinational pattern of export revealed that the EU member countries topped the buyers list sharing Tk. 131134.0 crore (58.7%) of the total export receipts during the year under review as against Tk. 145763.1 crore (59.2%) in the preceding year.
The second largest buyer of Bangladeshi goods was the member countries of NAFTA. The shares of NAFTA was Tk. 41593.3 crore (18.6%) of the total exports as compared to Tk. 47235.7 crore (19.2%) during 2018-2019.
Other Asian countries imported Bangladeshi goods worth Tk. 14157.4 crore (6.3%) during the year 2019-2020 as against Tk. 15616.6 crore (6.3%) during the previous year.
The OIC countries share was Tk. 12162.6 crore (5.4%) as against Tk. 11765.3 crore (4.8%) during the previous year.
ACU member countries, Other European countries, SAARC, Developing Eight, OPEC and ASEAN countries accounted for Tk. 8711.3 crore (3.9%), Tk. 8487.3 crore (3.8%), Tk. 8426.5 crore (3.8 %), Tk. 6309.4 crore (2.8 %), Tk. 4841.5 crore (2.2%) and Tk. 4170.1 crore (1.9%) respectively of the total export receipts during the year 2019-2020.
Table-4(A)[Taka in crore] & 4(B)[In million US$] shows the comparative position of export receipts from countries classified in a block/group/economic community during 2019-2020 and 2018-2019 along with their respective shares in the total export receipts of Bangladesh.
| (Taka in Crore) | ||||||
| Bloc/Group/Community | 2019-2020 | 2018-2019 | Changes (1-3) | |||
|---|---|---|---|---|---|---|
| Amount Taka | % of total export | Amount Taka | % of total export | |||
| 1 | 2 | 3 | 4 | 5 | ||
| E.U. | 131134.0 | 58.7 | 145763.1 | 59.2 | -14629.1 | |
| NAFTA | 41593.3 | 18.6 | 47235.7 | 19.2 | -5642.4 | |
| Other Asian Countries | 14157.4 | 6.3 | 15616.6 | 6.3 | -1459.2 | |
| OIC | 12162.6 | 5.4 | 11765.3 | 4.8 | 397.3 | |
| ACU | 8711.3 | 3.9 | 9261.7 | 3.8 | -550.4 | |
| Other European Countries | 8487.3 | 3.8 | 8035.3 | 3.3 | 452.0 | |
| SAARC | 8426.5 | 3.8 | 8938.0 | 3.6 | -511.5 | |
| Developing Eight | 6309.4 | 2.8 | 5912.6 | 2.4 | 396.8 | |
| OPEC | 4841.5 | 2.2 | 4854.9 | 2.0 | -13.4 | |
| ASEAN | 4170.1 | 1.9 | 4386.0 | 1.8 | -215.9 | |
| Other Countries | 9606.2 | 4.3 | 10337.1 | 4.2 | -730.9 | |
| Total Export Receipts (excluding EPZ) | 223548.4 | 246308.3 | -22759.9 | |||
| (Million US $) | ||||||
| Bloc/Group/Community | 2019-2020 | 2018-2019 | Changes (1-3) | |||
|---|---|---|---|---|---|---|
| Amount US Dollar | % of total export | Amount US Dollar | % of total export | |||
| 1 | 2 | 3 | 4 | 5 | ||
| E.U. | 15470.0 | 58.7 | 17346.0 | 59.2 | -1876.0 | |
| NAFTA | 4907.0 | 18.6 | 5621.0 | 19.2 | -714.0 | |
| Other Asian Countries | 1670.0 | 6.3 | 1859.0 | 6.3 | -189.0 | |
| OIC | 1435.0 | 5.4 | 1400.0 | 4.8 | 35.0 | |
| ACU | 1028.0 | 3.9 | 1102.0 | 3.8 | -74.0 | |
| Other European Countries | 1001.0 | 3.8 | 956.0 | 3.3 | 45.0 | |
| SAARC | 994.0 | 3.8 | 1064.0 | 3.6 | -70.0 | |
| Developing Eight | 744.0 | 2.8 | 704.0 | 2.4 | 40.0 | |
| OPEC | 571.0 | 2.2 | 578.0 | 2.0 | -7.0 | |
| ASEAN | 492.0 | 1.9 | 522.0 | 1.8 | -30.0 | |
| Other Countries | 1133.0 | 4.3 | 1230.0 | 4.2 | -97.0 | |
| Total Export Receipts (excluding EPZ) | 26372.0 | 29311.0 | -2939.0 | |||
Note: 1. Idonesia included in OIC and ASEAN
2. Exports of EPZ are not included in the above table