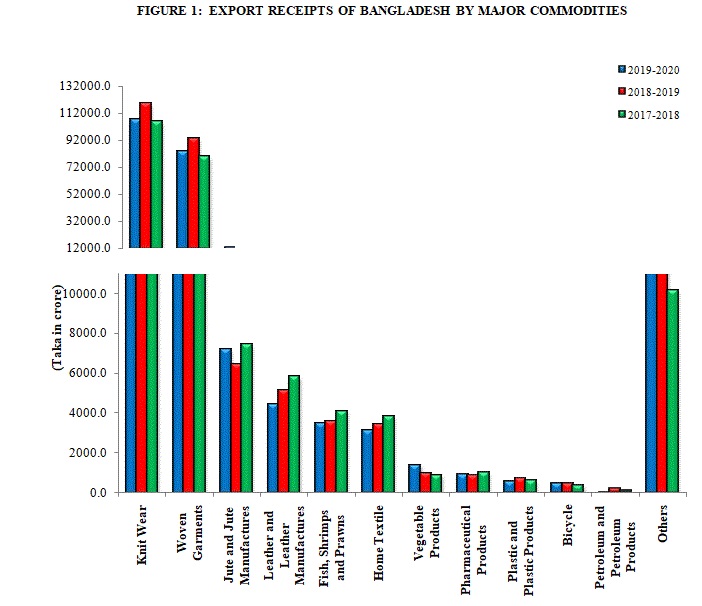
Major Commodity Graph
| (Taka in Crore) | ||||||
| Commodities | 2019-2020 | % of Total | 2018-2019 | % of Total | 2017-2018 | % of Total |
|---|---|---|---|---|---|---|
| Knit Wear | 107433.1 | 48.1 | 119039.5 | 48.3 | 105713.9 | 48.1 |
| Woven Garments | 83441.6 | 37.3 | 93316.2 | 37.9 | 79697.9 | 36.3 |
| Jute and Jute Manufactures | 7186.1 | 3.2 | 6432.9 | 2.6 | 7436.6 | 3.4 |
| Leather and Leather Manufactures | 4398.1 | 2.0 | 5137.1 | 2.1 | 5805.8 | 2.6 |
| Fish, Shrimps and Prawns | 3442.8 | 1.5 | 3556.3 | 1.4 | 4087.7 | 1.9 |
| Home Textile | 3097.8 | 1.4 | 3397.6 | 1.4 | 3827.0 | 1.7 |
| Vegetable Products | 1381.4 | 0.6 | 976.4 | 0.4 | 872.7 | 0.4 |
| Pharmaceutical Products | 879.6 | 0.4 | 846.5 | 0.3 | 988.4 | 0.4 |
| Plastic and Plastic Products | 537.8 | 0.2 | 705.0 | 0.3 | 607.0 | 0.3 |
| Bicycle | 450.9 | 0.2 | 436.0 | 0.2 | 358.0 | 0.2 |
| Petroleum and Petroleum Products | 9.1 | 0.0 | 188.4 | 0.1 | 80.2 | 0.0 |
| Others | 11290.1 | 5.1 | 12276.4 | 5.0 | 10177.0 | 4.6 |
| Total | 223548.4 | 100.0 | 246308.3 | 100.0 | 219652.2 | 100.0 |
